William Ware
Graphs
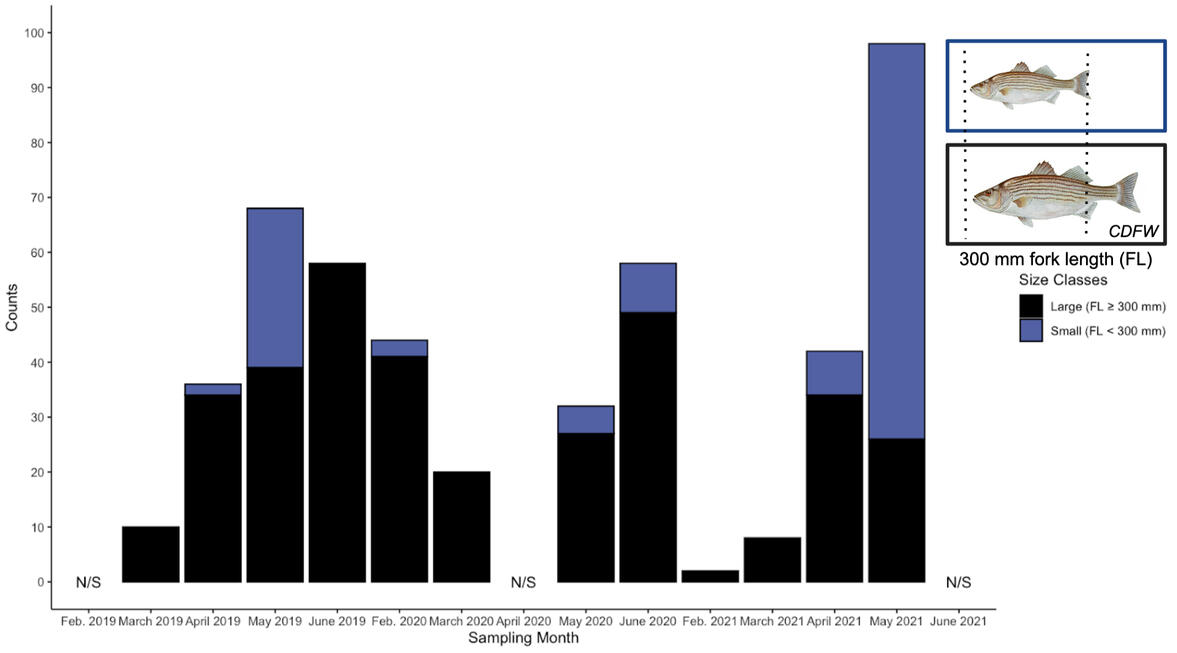
I worked with FISHBIO, Inc. to determine when two size groups of striped bass (Morone saxatilis) were on the Stanislaus River via the above bar plot, which shows the observed counts of all captured fish (y-axis) by sampling months (x-axis)The above graph links to my brief talk on how striped bass research supports diverse people.
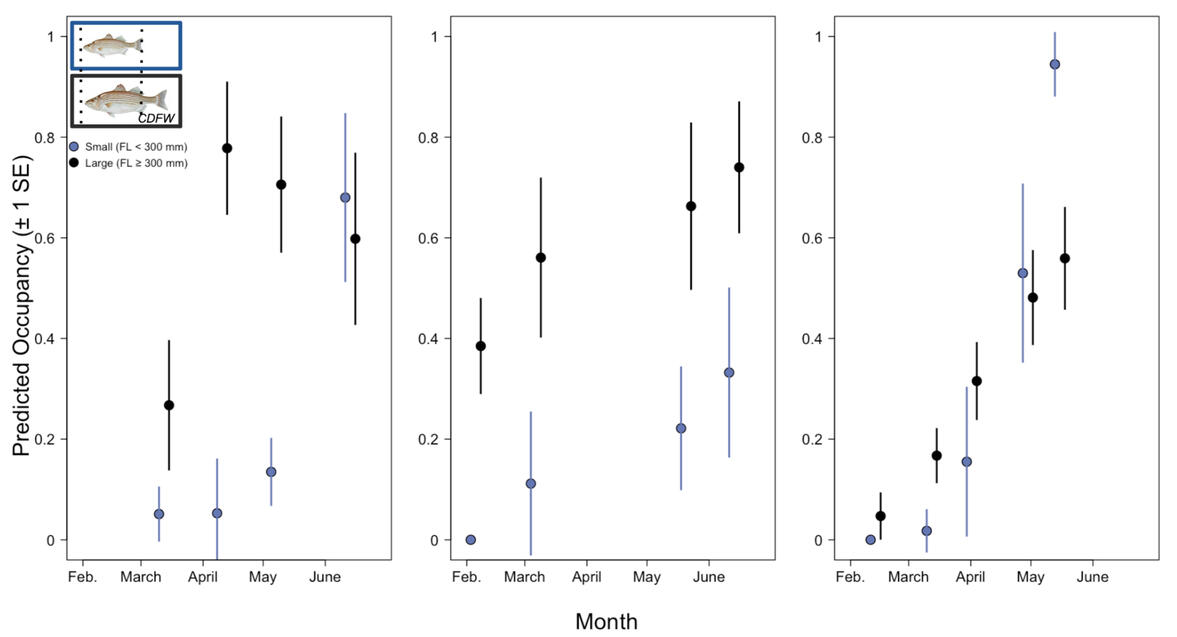
I also co-developed dynamic occupancy models for when small and large striped bass were on the Stanislaus River. Model predictions (y-axis) for both size groups are shown by sampling months (x-axis) for each study yearThe above graph links to a quick description of why this research matters.
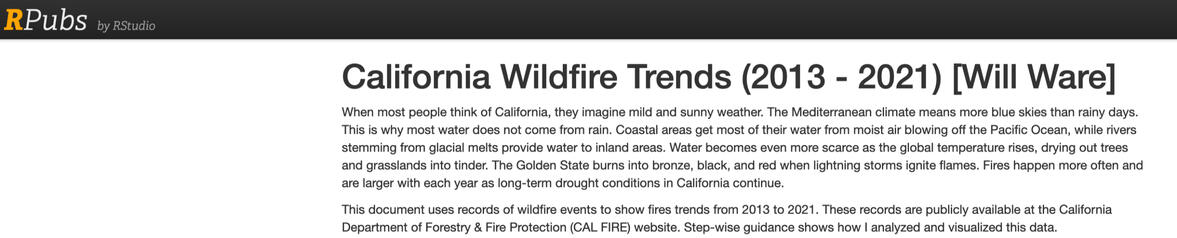
The above figure is a preview of the website I that developed to show the increasing number of acres burned by recent California wildfires.
Maps

This map of zip codes (grey lines) with geometric centers (black points) overlaid with USDA-certified food deserts (blue polygons) in Alachua County, Florida in the United States formed with ArcGIS Pro.Self-Assessment:
- Strengths -
(1) Listed source data
(2) Default label placement
(3) Legend, scale, & compass
- Improvements -
(1) Remove roads from base map
(2) manually adjust label placement
(3) show zip code population centers
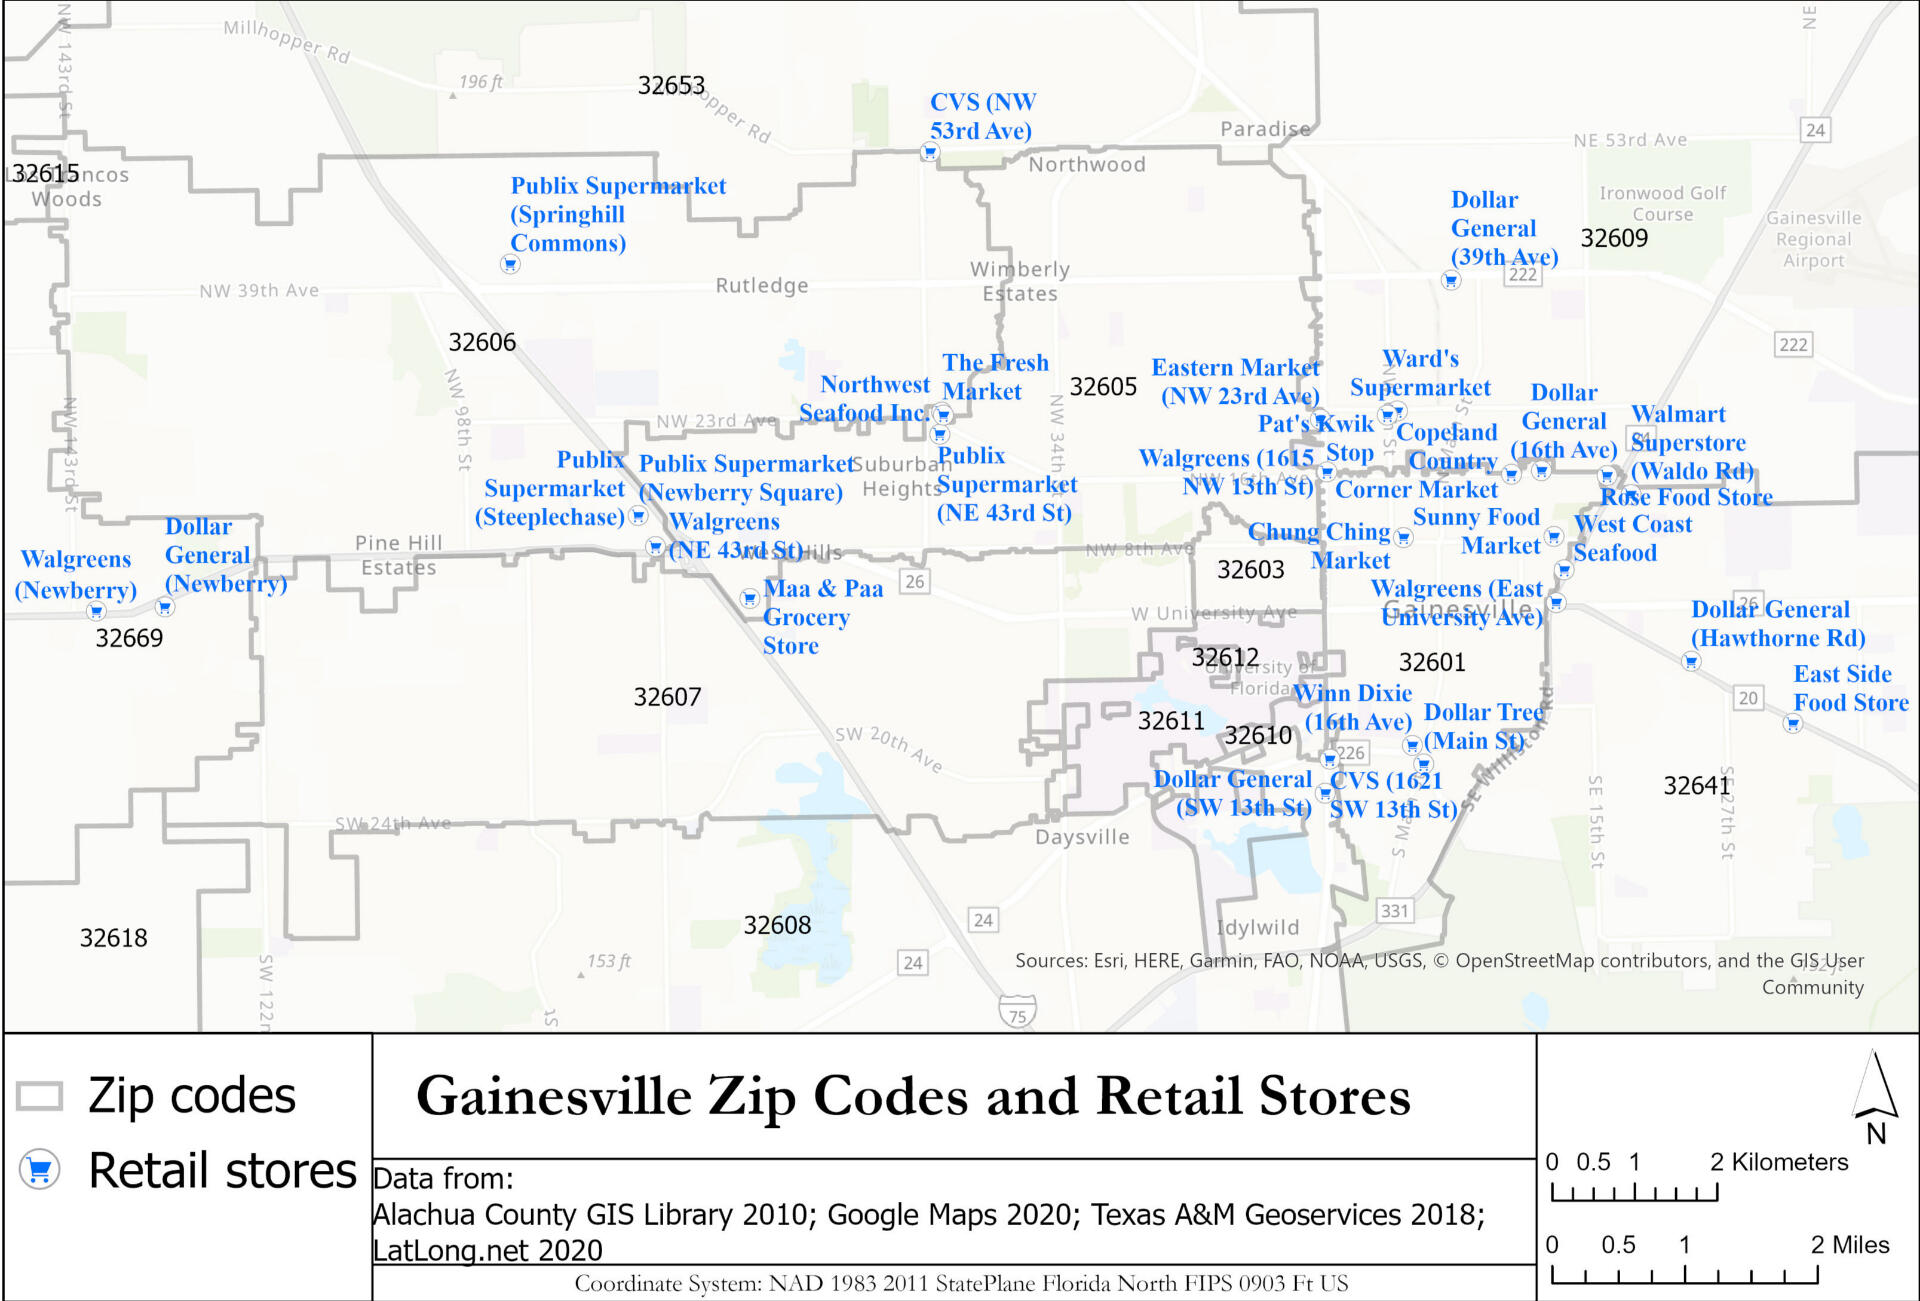
This map of retail stores has zip codes (grey lines) and retail stores (blue shopping cart icons).Methods:
I surveyed seafood options at each retailer, geocoded the addresses into latitude and longitude coordinates, and created attribute tables with quantitative and qualitative data.Self-Assessment:
- Improvements -
(1) Use pop-up labels for stores
(2) Increase base map transparency
Graphics
I converted a picture of me snorkeling into a smart image, masked it to the letter "N" in a text layer, and added a text box all in Adobe Illustrator.

I overlaid two images as separate masking layers, adjusting the transparency of one, before adding a text box all in Adobe Photoshop.
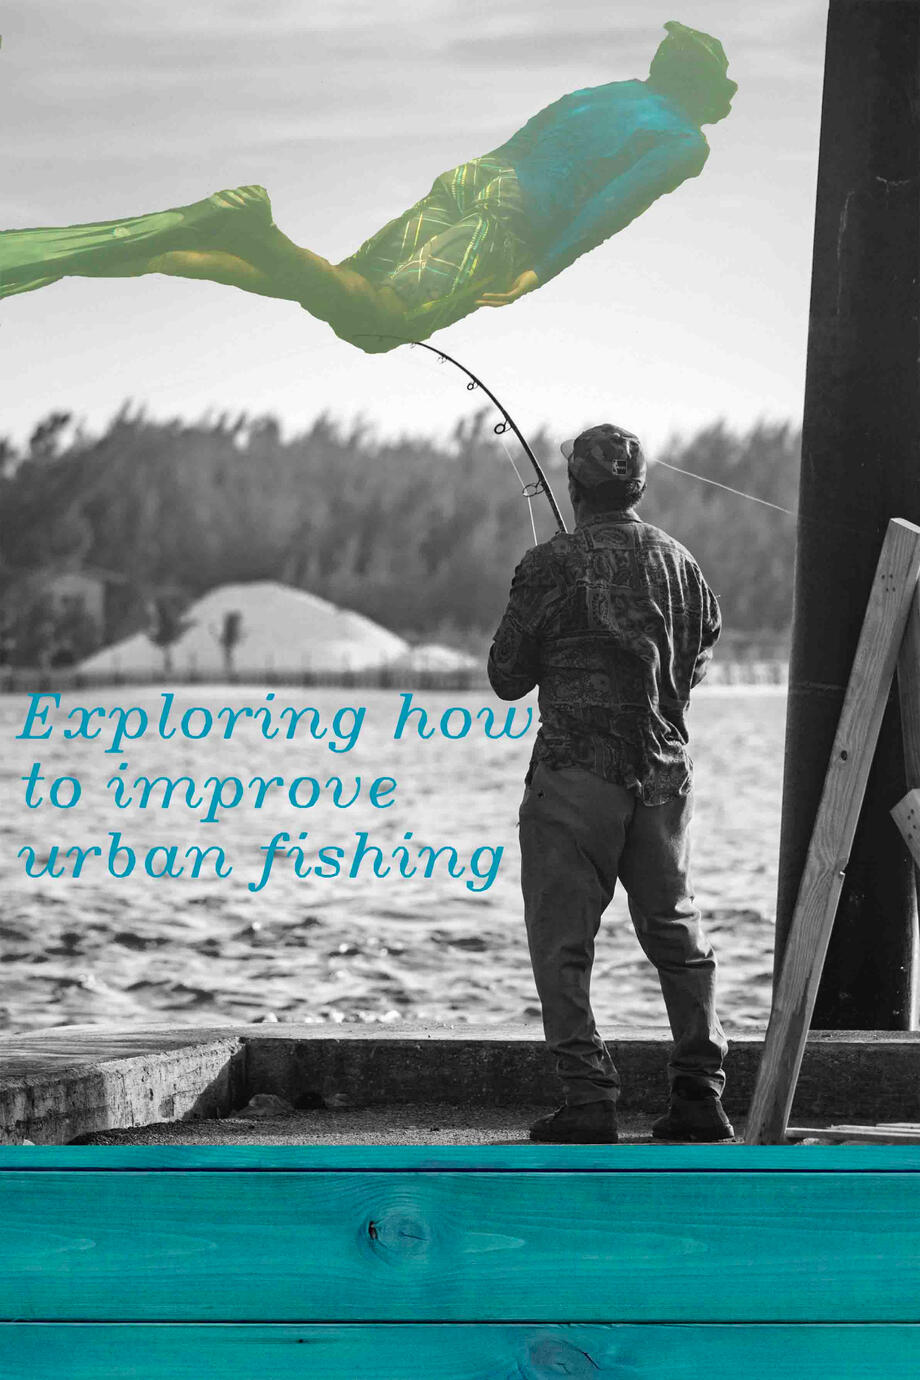
Methods:
I formed this image via 6 steps in Adobe Photoshop by lowering the saturation in a stock photo of a fisher to zero percent, adding a duplicate layer of the fisher to adjust lighting, erasing the background from a photo of me snorkeling, combining images, increasing the transparency to 5, and adding a stock photo of wood to the bottom of the image.Lessons Learned:
I should save intermediate drafts as Photoshop files because JPEG files merge separate photo layers into one layer that cannot be separated. This is why I could not colorize the shirt patterns, despite trying to make a new layer using the "Quick Selection" then "Lasso" tools, and why I could not colorize the wood with a gradient pattern.